Nick Wray BSc MSc GradStat

Bachelor of Science in Geology, Engineering Geology and Chemistry • University of Exeter
Post-Graduate Certificate in Education • University of Keele
Graduate Certificate in Statistics • University of Sheffield
Master of Science in Statistics and Applied Probability • University of Nottingham
Why Use a Statistician?
If you want to make sure that your business structure and plans are cost effective and maximise returns, that your equipment usage and staff deployment are efficient, and that your products are within specified dimensional and quality tolerances, statistical applications allow you to keep control of the quality and levels of current output and performance. They also enable optimal forecasts to be made of future trends in sales, demand and external factors affecting your business.
Experience and Knowledge
I have thirty years’ experience in mathematical and scientific work, as a statistical and mathematical analyst, teacher and lecturer, and translator. I speak German, French, Russian and Spanish.
Publications and Conferences
Understanding Train Performance Using Data Analysis — an article about my statistical techniques for locomotive monitoring in the Railway Gazette, the world’s widest selling technical rail journal, Nov 2017
Solving the Location Problem — Royal Statistical Society Lecture Presentation, RSS International Conference, Glasgow, Sep 7th 2017
Developing Rolling Stock Fault Analysis and Key Performance Indicators Using Statistical Modelling — Institute of Engineering and Technology Journal 2016, delivered at the IET Railway Condition Monitoring Conference, Birmingham, Sep 2016
Developing Rolling Stock Fault Analysis and Key Performance Indicators Using Statistical Modelling (update) — Journal of Mechanical Engineering Science 2017, delivered at the Stephenson Conference, Institution of Mechanical Engineers, London, April 2017
Confidentiality
All data and material supplied will be kept confidential and only used for the specified purposes of the consulting contract, in accordance with the Data Protection Act.
Applications of Statistics and Mathematics
Many important business questions can be answered by statistical applications, such as:
- Missing Data Reconstruction
- Quality Control of Product Output
- Oversight of Product Specification Tolerances
- Efficient Equipment Usage and Replacement
- Optimisation of Staff Numbers
- Customer Patterns and Throughput Optimisation
- Examination of Sickness Rates and Absence Patterns
- Wastage Rate Analysis
- Customer Needs and Satisfaction Survey Design
- Statistical Education for Staff
- Assessment of Products Sold in Association
- Price, Demand and Sales Trend Analysis and Forecasting
Examples of Projects carried out by Peak Statistics:
Condition Monitoring of Railway Locomotive Performance Peak Statistics collected data from locomotive units running on an English suburban rail network. The plot beneath shows the speed/time plots generated by two locomotive units as they made repeated shuttle journeys over the same stretch of a suburban rail network on the same day. It can be seen that the strands for Unit 1 (black) are on average slightly faster than those for Unit 2, and that there is much more consistency in the values of the strands of Unit 1. The maintenance team was therefore directed towards Unit 2 as a priority, directed maintenance being a more efficient and cost-effective strategy than looking at each locomotive in turn.

Business Forecasting Algorithms Peak Statistics has developed iterative forecasting methods which allow forecasts to be given with appropriate confidence intervals.

Given the year’s worth of sales figures (in black), we can say that, for example, 95% of the time such a sequence would lead to the next year’s sales being between the upper and lower red dots. This work was carried out for a business development company in Leicestershire.
Sound Waves as Condition Monitors The sound wave beneath was generated by a locomotive component.
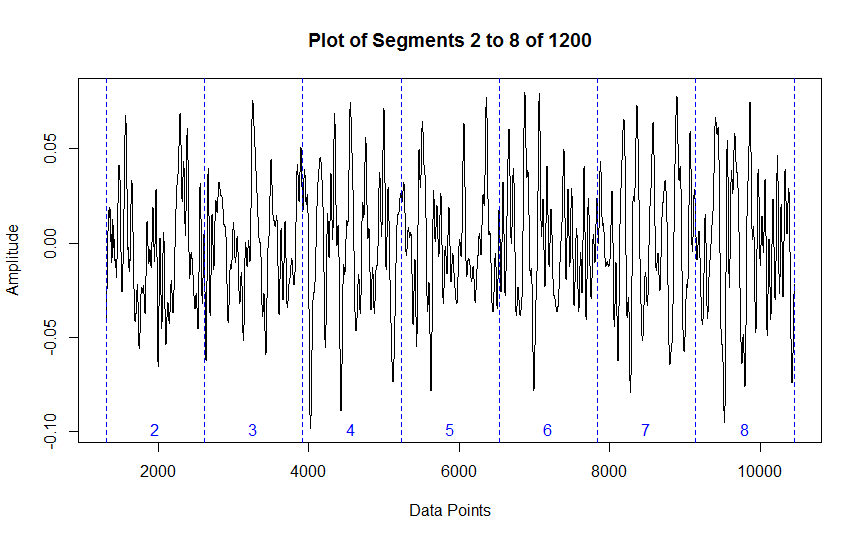
It seems at first glance to be a chaotic and random process, but when a statistical technique known as autocorrelation is applied to the data, the underlying structure becomes apparent:

We can use deviations from the underlying regularity as indicator of malfunction. Furthermore, by using the mathematical technique of Fourier transforms, we can break the wave down into regular component waves of different wavelength. We see that different wavelengths make different contributions to the original wave, and that variation in these proportions will act as a monitoring control.
Trajectories in Computer Games Thrown objects and mechanical devices in role-play games have to move realistically so that the player can use and forecast their effects. Using polynomial and trigonometric equations Peak Statistics calculated pathways in a game for Core Design, Derby.
Comparison of Pump Components in Pneumatic Cylinders Train carriage door mechanism cylinders were fitted with a new kind of pump. Before the rest of the fleet were equipped with the new pumps there was a need for the rolling stock operating company to know whether the new pumps were significantly more efficient than the older kind. Efficiency was defined in terms of pump-up time, ie how long the cylinder took to reach maximum overpressure.
Each individual cylinder had pump-up time recorded by Peak Statistics with old pump in use, and then with the new pump. It is important to test each cylinder against itself to remove other factors affecting the outcome.
| Cylinder Number | Mean Time with Old Pump in Seconds | Mean Time with New Pump in Seconds |
| 1 | 33.2 | 34.0 |
| 2 | 44.5 | 37.8 |
| 3 | 38.7 | 35.0 |
| 4 | 41.0 | 30.0 |
| 5 | 37.9 | 27.8 |
| 6 | 48.1 | 41.6 |
| 7 | 35.5 | 32.8 |
| 8 | 39.8 | 34.3 |
| 9 | 42.1 | 35.9 |
| 10 | 43.0 | 34.7 |
| 11 | 36.4, | 35.2 |
| 12 | 40.4 | 37.2 |
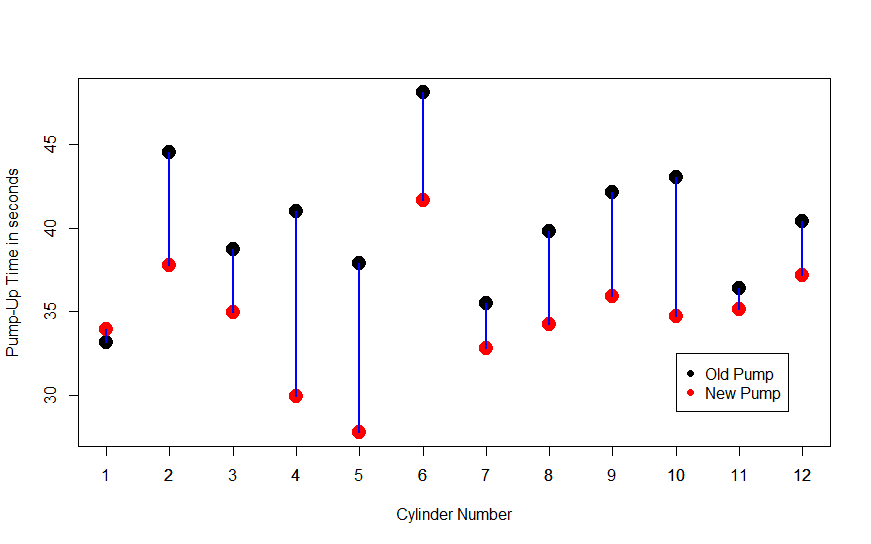
The question is whether the mean difference in pump-up time between the two sets of data is statistically significant, and in this case a statistical test tells us that the chances of the result coming about by chance is about one in four hundred. We can therefore safely assume that installing the new pumps decreases the cylinders’ pump-up times.
Big Data Filtration and Cleaning To filter out all medical prescriptions relating to asthmatic conditions written in Leeds in any given month from the all-England Excel prescription databases, (which are so large that they cannot be run using Excel) the data were translated and processed by Peak Statistics into the language R, in which filtration and data cleaning were possible within reasonable lengths of time. This project was carried out for Hebe Works of Leeds

Placement of New Factory Sites A Derbyshire company was looking to set up a new factory, and the most profitable location (black dot), taking into account distance from markets (highest density of consumers in red, and lowest in blue), was determined by an optimising computer algorithm written by Peak Statistics.

The black dot is placed by the algorithm at the point minimally distant from the largest population density.
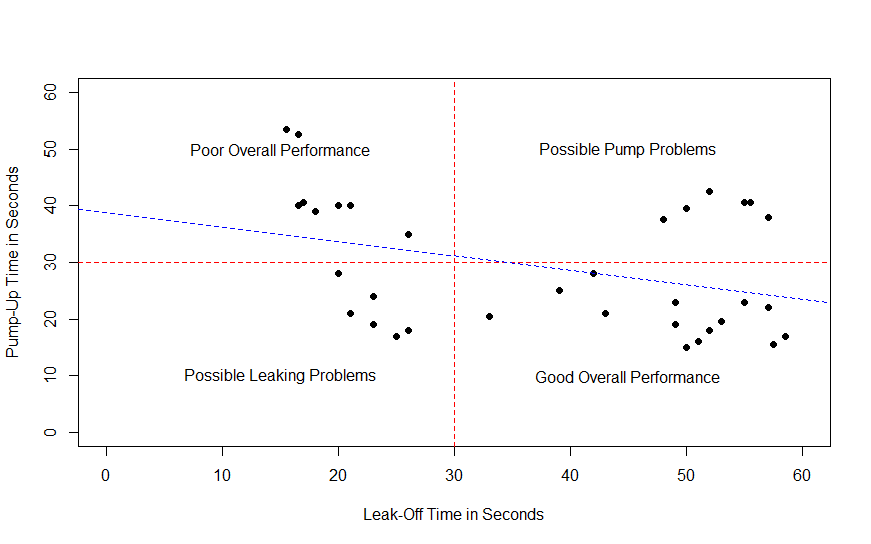
Ageing of Pneumatic Cylinder Components Train carriages use pneumatic cylinders to open and shut the doors. The efficiency of the cylinders depends on two factors – how effectively the pumps supply air at overpressure into the cylinder (pump-up time), and how slowly air leaks out through the seals (leak-off time). Peak Statistics analysed leak-off time against pump-up time. A plot shows that the cylinders fell into four performance clusters and enables us to identify the cylinders which may need attention. The blue dotted line is the least-squares regression of pump-up time against leak-off, showing that, as the components age, pump-up time tends to increase as leak-off time decreases
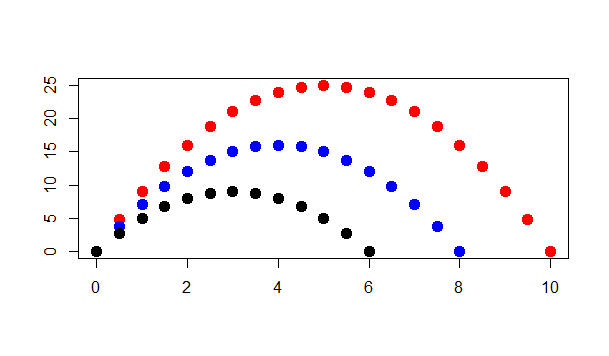
Variability of Agricultural Seed Crops An agricultural producer needed to know the probability of getting an equal mix of two species in the same crop when the germination rates were not the same.

The red dots show the probability of an equal mixture when a seed chosen at random is equally likely to give either species, the blue dots the probabilities when a random seed will give the first species 5/8 of the time, and the black dots the probabilities when a random seed will give the first species 3/4 of the time.
Seasonality of Locomotive Skidding Peak Statistics was asked by a regional rail network to investigate whether there was a seasonal pattern to increased activation of the anti-skid devices fitted to locomotives. The hypothesis is that there will be two seasons for skidding, one being mid-autumn when there are large numbers of wet leaves falling onto lines, running into another in the coldest part of midwinter, when icing is a problem. The number of activations of antiskid devices over a six year period was plotted as a time series. There are regular peaks every year where the antiskid devices are activated at a higher frequency, suggesting that measures against skidding need to be applied seasonally.

Distribution of AC Current Voltages with Frequency
An electrical engineering company needed to know the time-wise spread of voltage values for different frequencies of an AC supply. Peak Statistics mapped the distributions for different supplies. The diagram beneath shows, for example, that at 300 Herz the potential difference was no more than 10V for about half the time, and between 20V and the maximum of 32V for 10% of the time.

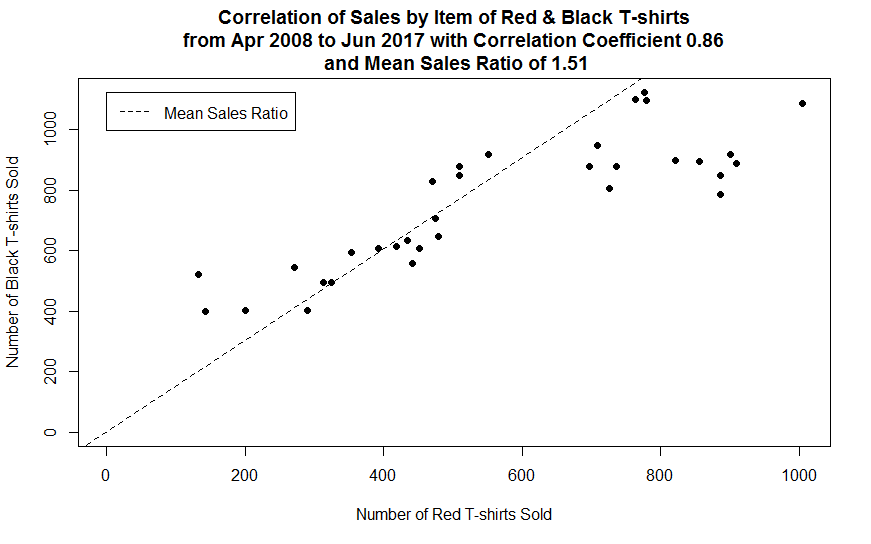
Analysis of Retail Sales A clothing warehouse which sold T-shirts in various colours wanted analysis of aspects of their sales. By calculating the high correlation coefficient between the sales of the two items, Peak Statistics was able to show that there is a statistically reliable and consistent optimum ordering ratio of two red to every three black T-shirts:
Using Time Series analysis it was possible to provide sales forecasts within confidence limits:

and to get a very commercially useful isolation of the seasonal component within the sales:

Simulation of Battery Load A rolling stock operating company wanted to upgrade the batteries on its locomotives, but needed to know how much charge the battery would need to have in order for the train to always be sure of reaching the end of its run. The greater the energy capacity, the heavier and costlier the battery becomes, and therefore an optimised solution is needed. Peak Statistics carried out a simulation of trains running over a real shuttle route to see what the optimum battery load would be.

The simulation allowed a reliable operating margin to be calculated.